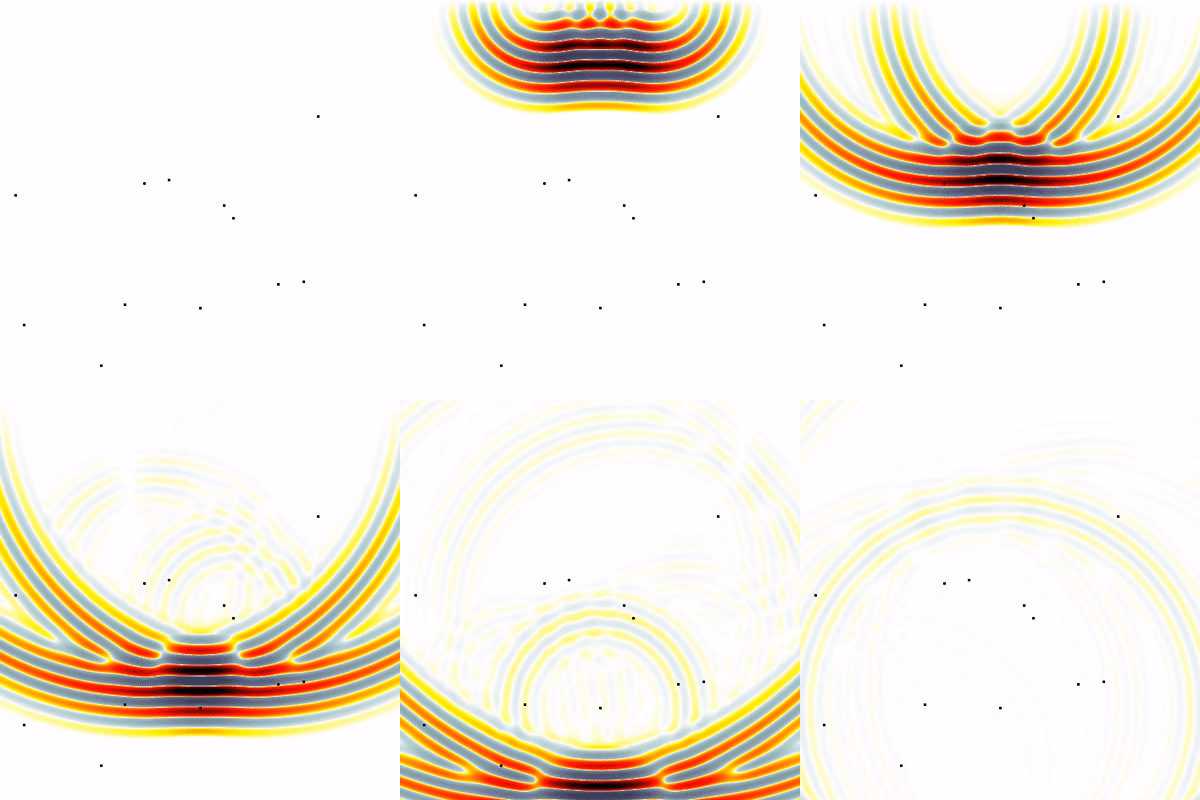
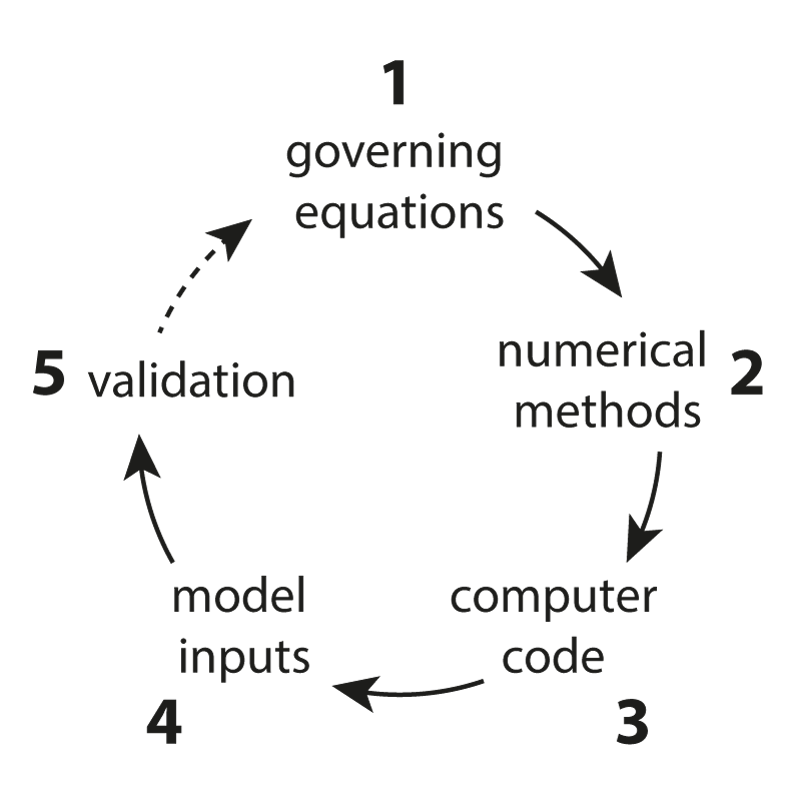
One of the main research goals of the UCL Biomedical Ultrasound Group is the development of computer models that can accurately and efficiently predict how ultrasound waves travel through the human body. These are then used to develop treatment planning tools for therapeutic ultrasound, for example, to correct for distortions induced by bones and to predict treatment outcomes before the ultrasound is delivered. There are five distinct components to the development of scientific software for this application (see Figure 1) which are described below.
- Governing Equations: The mathematical formulas that describe the physics of the interaction between ultrasound waves and tissue are known as governing equations. Typically, these are based on the conservation of energy (the tissue has inertia), the conservation of mass (the tissue is compressible), and an equation of state (the thermodynamics of wave propagation). Together these account for highly-complex wave behaviour, including scattering, refraction, nonlinear wave steepening, and acoustic absorption (the loss of the coherent mechanical energy of the wave to heat). One of our main research contributions to this area is the development of new equations that describe nonlinear wave propagation and power-law acoustic absorption (absorption that is proportional to the frequency of the ultrasound wave raised to a non-integer power).
- Numerical Methods: The techniques used to discretise the governing equations so they can be solved within a computer are known as numerical methods. There are many different types of numerical methods, including the widely used finite-element method. Our research focusses on a particular type of numerical method that is very well-suited to modelling high-frequency ultrasound waves over the length scale of the human body. This technique is called the Fourier pseudospectral method and represents waves using a Fourier basis, that is, as a collection of sine and cosine waves of different frequencies. Fourier methods have many nice properties that we exploit to solve the governing equations accurately and efficiently. Our research in this area covers a wide variety of topics, including how to correct for numerical errors known as dispersion, how to define the grid on which the solution is calculated using a measure of the local bandwidth of the acoustic field, and how to compute wave-fields very quickly when the medium consists of layers or the source has a single frequency.
- Computer Code: Once a numerical method has been developed, this must be turned into a computer program that runs as quickly as possible while minimising the computational resources used (e.g., memory). Our research in this area is conducted in collaboration with the Supercomputing Group at the Brno University of Technology and is split into three areas.
- High-performance computing: Here the goal is to map the numerical operations (e.g., multiplying two matrices or performing a fast Fourier transform) to the computer hardware (e.g., a graphical processing unit or supercomputer) as efficiently as possible. We have developed optimised codes for running on desktop computers, supercomputers, and clusters of graphical processing units (GPUs).
- Open-source software release: The results of our research are packaged into an open-source acoustics toolbox for MATLAB called k-Wave. This is designed for time-domain acoustic and ultrasound simulations in complex and tissue-realistic media, with a particular emphasis on ensuring the models are both fast and easy to use. The toolbox contains a lot of documentation to get started, including more than 60 worked examples, a forum, and an extensive user manual.
- Clinical user interface: The translation of scientific software for clinical use requires a specially-designed user-interface so that clinicians can interact productively with the software to achieve a clinical goal. We are currently developing a clinical user interface to allow end-users, such as doctors, to easily use our codes for treatment planning in therapeutic ultrasound without requiring any knowledge of the low-level computer code or even the underlying physical principles. This software is also being developed within the strict regulations for medical software that ensure it is effective and safe.
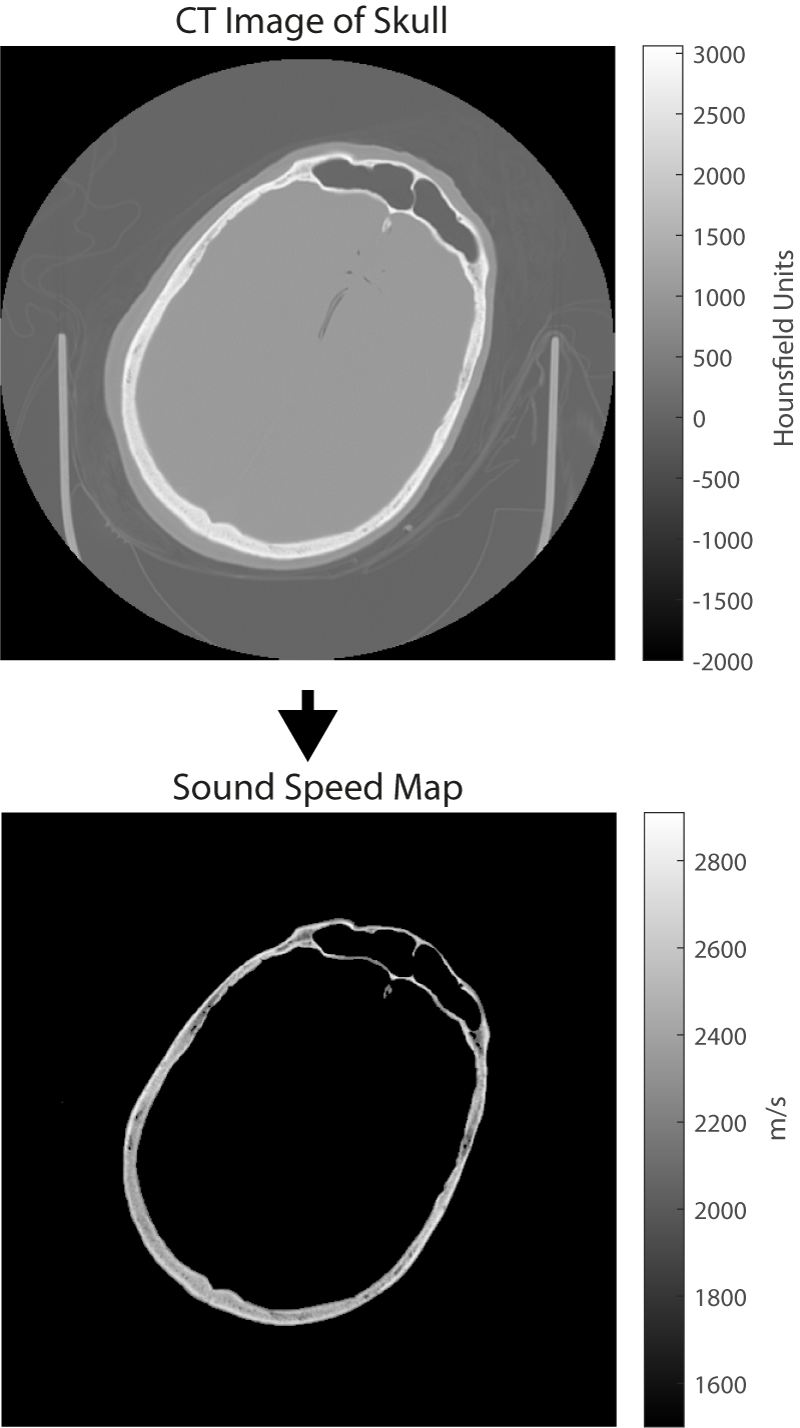
- Model Inputs: The accurate prediction of how an ultrasound wave travels through the body requires a detailed map of how the acoustic material properties (such as the sound speed) vary through the body. Typically, these are obtained from standard medical images such as x-ray computed tomography (CT) or magnetic resonance (MR) imaging. When using CT images, it is possible to directly convert the grayscale values in the image to acoustic properties (see Figure 2). When using MR images, the different organs within the body first have to be identified and then known values (usually measured from ex vivo tissue) are assigned. An accurate characterisation of the acoustic transducer that generates the ultrasound waves is also required. Our research in this area includes measuring the acoustic properties of human tissue, investigating how best to convert from medical images to maps of acoustic properties, and measuring and modelling the output of different ultrasound sources.
- Model Validation: Checking whether a computer program gives the correct answer under different circumstances is known as model validation. Errors can come from several different places, including invalid assumptions made when developing the governing equations, the wrong choice of grid parameters in the numerical model, mistakes in the code, and inaccurate model inputs. The validation of numerical models is an important part of the software design life-cycle. However, for medical software, this is essential for patient safety. Models can be validated in a number of ways, including: (1) performing a convergence test (computing the results on a finer grid and checking whether the predicted answer is the same), (2) modelling scenarios where there is a known solution (for example, the scattering of an acoustic wave by a sphere can be calculated analytically), and (3) comparing against experimental measurements. Model validation forms an integral part of our work. More details about our programme of experimental validation can be found in the Ultrasound Field Measurement tab.
The models developed in BUG are now widely used around the world for modelling therapeutic ultrasound. Some examples include modelling thermal and non-thermal ablation in the brain, neuromodulation, and opening the blood-brain barrier. The models are also used widely outside of ultrasound therapy. For example, they also form a platform for the reconstruction of diagnostic images in photoacoustic imaging and ultrasound computed tomography. This is described further in the Image Reconstruction tab.
The use of ultrasound as a diagnostic imaging tool is well known, particularly during pregnancy where ultrasound is used to create pictures of the developing babies. In recent years, a growing number of therapeutic applications of ultrasound have also been demonstrated. The goal of therapeutic ultrasound is to modify the function or structure of the tissue, rather than produce an anatomical image. This is possible because the mechanical vibrations caused by the ultrasound waves can affect tissue in different ways, for example, by causing the tissue to heat up or by generating internal radiation forces that can agitate the cells or tissue scaffolding. These ultrasound bioeffects offer enormous potential to develop new ways to treat major diseases. For example, in the last few years, clinical trials have demonstrated the ability of ultrasound to destroy cells through rapid heating for the treatment of cancer and neurological disorders, target the delivery of anticancer drugs, stimulate or modulate the excitability of neurons, and temporarily open the blood-brain barrier to allow drugs to be delivered more effectively. These treatments are all completely non-invasive and have the potential to significantly improve outcomes for patients.
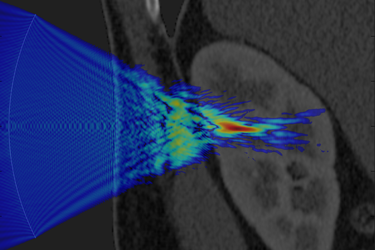
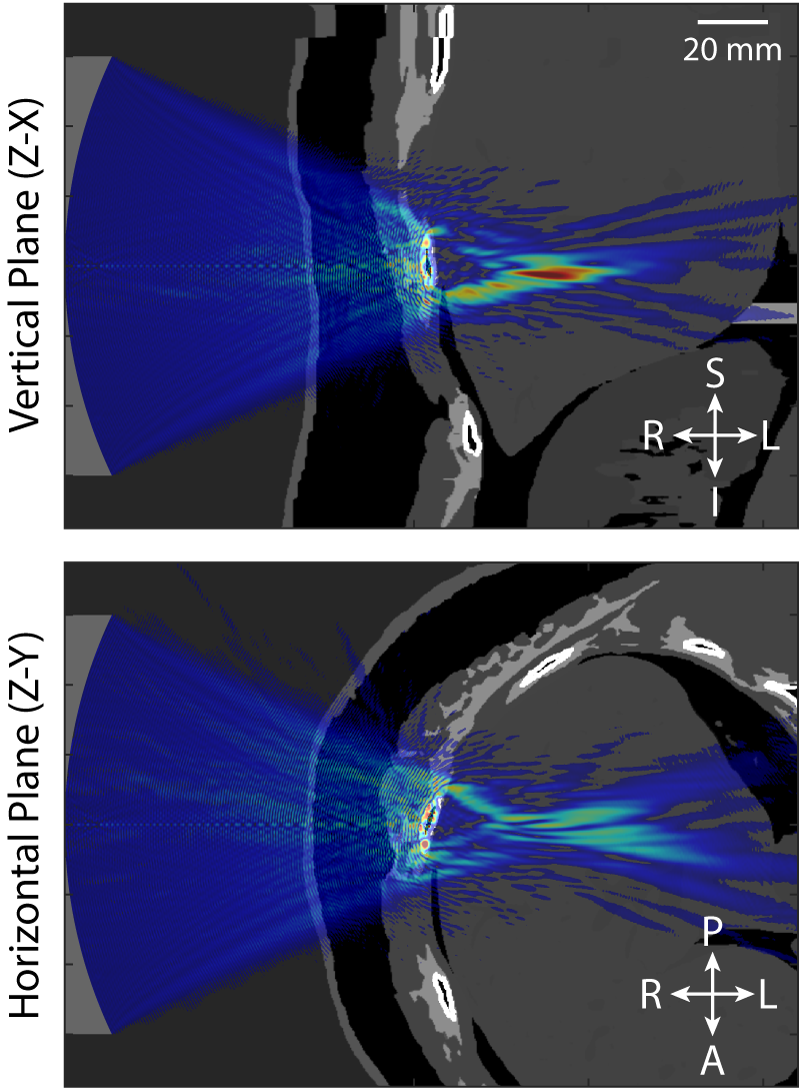
The fundamental challenge shared by all applications of therapeutic ultrasound is that the ultrasound energy must be delivered accurately, safely, and non-invasively to the target region within the body identified by the doctor. This is difficult because bones and other tissue interfaces can severely distort the shape of the ultrasound beam (an example is given in Figure 1). This has a significant impact on the safety and effectiveness of therapeutic ultrasound and presents a major hurdle for the wider clinical acceptance of these exciting technologies. In principle, it is possible to predict and correct for these distortions using powerful computer models of how ultrasound waves travel through the body. However, the underlying physics is complex and the scale of the modelling problem requires extremely large amounts of computer memory. This means that most clinical treatments do not correct for distortions or use vastly simplified models to do so.
Model Validation
Before simulations can be used for planning therapeutic ultrasound treatments (or for other clinical applications), the accuracy of the models must be rigorously tested. In most cases, there are no analytical solutions available, so models must be experimentally validated. Within the Biomedical Ultrasound Group, a program of experimental validation is currently underway, using a step by step approach beginning with the simplest configuration of a linear ultrasound field in water, then with increasingly nonlinear fields, and increasingly complex propagation media.
Validation measurements start with characterisation of the source transducer. The source pressure (time varying or steady-state) is obtained using acoustic holography from a planar measurement of the ultrasound field, under linear conditions in water. This source pressure is used to define the source in k-Wave, and amplitude scaling is applied to match the drive level used in validation experiments. Ultrasound propagation through the medium is then simulated, with the geometry and the physical properties of the simulated medium matched to the experimental configuration. Further measurements of the acoustic field at relevant locations are then made for comparison. These could be, for example, through the focus of the field for comparison of the location, volume and amplitude, or they may be on lines or planes beyond a phantom for direct comparison of the field distribution if there is significant aberration.
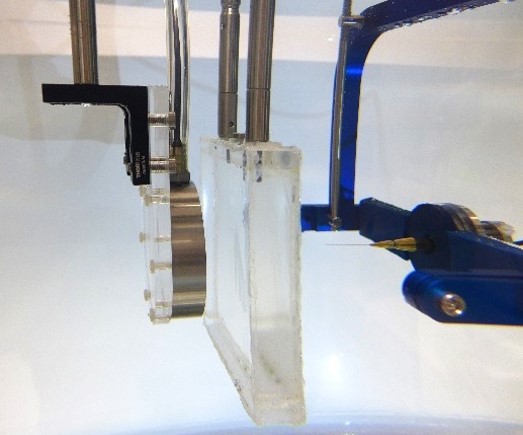
To date, we have shown that measurements of focal pressure in weakly nonlinear focused ultrasound fields after propagation through absorbing glycerol phantoms (see Figure 1) agree with simulations to within 10%, which is within the expected uncertainty on hydrophone measurements of these fields (see Repeatability and reproducibility of hydrophone measurements section). Focal positions differed by approximately 1 mm and the size of the focus agreed to within 4%. Similarly, measurements of linear fields after propagation through 3D printed anatomical skull bone mimicking phantoms (see Figure 2) agreed well with simulations. The peak focal pressures agreed to within 1%, the focal positions were within 1 mm and the focal volume differed by 2%. The measurement data associated with these studies can be accessed through the Data-Repository for Ultrasound Metrology.
Further work is ongoing to validate k-Wave simulations against measurements of ultrasound fields after propagation through ex vivo skulls. This includes investigation of the derivation of the medium properties from CT images of the skulls.
Repeatability and Reproducibility of Hydrophone Measurements
Measurements of acoustic pressure are made with calibrated hydrophones. The recorded voltages are band-pass filtered, and the pressure is obtained by deconvolution of the complex frequency response of the hydrophone. Uncertainties in the measured pressure can arise from various sources including positioning and other measurement conditions, fluctuations in the drive conditions and hydrophone sensitivity, and uncertainty on calibration data. To establish agreement between measured and simulated fields for validation, the accuracy of the measurements must also be determined. We have studied the repeatability and reproducibility of hydrophone measurements of fields by comparing measurements made with different hydrophones and between repeated measurements with the same hydrophone. This measurement data can be accessed through the Data-Repository for Ultrasound Metrology.
While measurements made using the same hydrophone in the same acoustic field can be made very consistently, accurately measuring absolute pressure is challenging. The choice of hydrophone is important, hydrophones with large element sizes will significantly underestimate the pressure due to spatial averaging, and for some hydrophones, it is important that the complex frequency response is well characterised to avoid errors in broadband fields.
High Pressure Measurements
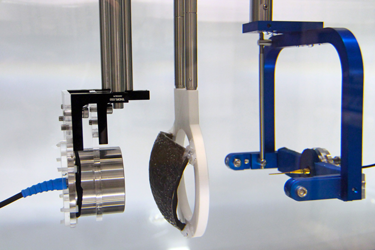
The acoustic pressure amplitudes generated at the focus of high-intensity focused ultrasound (HIFU) fields are generally much higher than the measurement range of most commercially available piezoelectric hydrophones. To validate models of ultrasound propagation at clinical drive levels and to fully characterise clinical focused ultrasound fields, measurement devices which can withstand the high temperatures and pressures generated at the focus of these fields are required.
To work towards this aim, a planar hard-dielectric Fabry-Pérot ultrasound sensor developed by the Photoacoustic Imaging Group, was tested for mapping of focused ultrasound fields at higher drive levels than can be measured by many available hydrophones. Maximum peak positive pressures of 25 MPa and peak negative pressure of 12 MPa were measured at the focus of a single element HIFU transducer. This measurement data can be accessed through the Data-Repository for Ultrasound Metrology.
The Fabry-Pérot sensor and scanning system has the advantages of broad bandwidth (over 100 MHz), low noise equivalent pressure, which is comparable to that of a 75 µm PVDF needle hydrophone, a small spot size (65 µm) and a rapid acquisition rate of 200 Hz, compared to the 1 Hz commonly for hydrophone measurements. Further work is ongoing on understanding the full response of the sensor to ultrasound to allow more accurate measurements, and to increase the high pressure range of the sensor.
Conventional Ultrasound Imaging
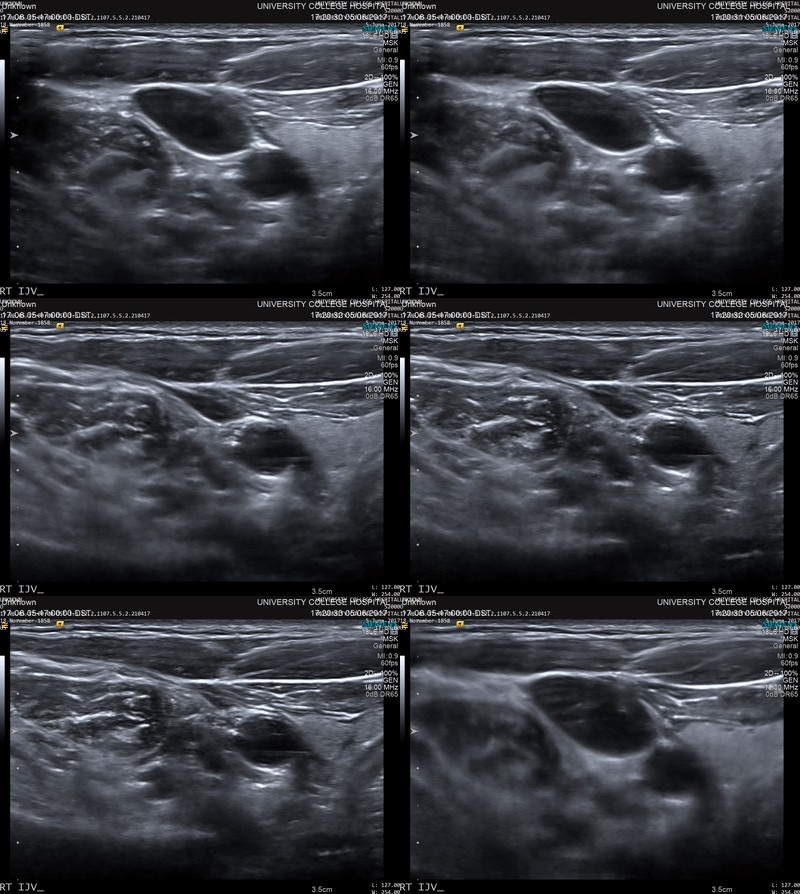
In conventional diagnostic ultrasound imaging, a pulse of ultrasound is transmitted into the body from an ultrasound probe. The same probe then detects the reflected ultrasound waves that scatter back from within the tissue and this data is used to form an image. An image of what? Acoustic waves are scattered when they encounter a change in the density or stiffness of the propagation medium (see Figure 1). In tissue, these changes occur at many microscopic points, for example, the cells and extracellular matrix. There are usually so many of these points spaced very close together that it is not possible to distinguish the locations where the scattering occurred (see Figure 2). Instead, tissue may be characterised by the total strength of the waves that are back-scattered. This quantity varies between tissue types and is sometimes referred to as echogenicity. A clinical ultrasound image can be thought of as a map of the echogenicity of the tissue, with some tissues appearing bright and some appearing dark (see Figure 3).
The advantages of ultrasound imaging are that it can be performed in real-time, it is inexpensive compared to some other imaging modalities, the images have high resolution, and information about blood flow can be obtained using Doppler techniques. The disadvantages are that the image contrast (the echogenicity) can be weak for some important targets such as small blood vessels, and the images are usually just a 2D slice through the tissue. Also, and importantly, the echogenicity cannot be easily related to more basic quantities, for example those linked directly to the chemical differences between the different constituents of the tissue. Even the relationship between echogenicity and the sound speed and density of the tissue is non-trivial.
In the UCL Biomedical Ultrasound Group, our focus is less on conventional ultrasound imaging than on two other exciting medical imaging modalities that use ultrasound: photoacoustic tomography and ultrasound computed tomography. These modalities offer the potential to overcome some of the limitations of conventional ultrasound imaging, although, of course, they have their own challenges.
Photoacoustic Tomography
In conventional reflection mode ultrasound imaging, ultrasound pulses are sent into tissue and the reflected ultrasound waves are used to form an image. In photoacoustic tomography, pulses of light are instead sent into tissue. This light generates ultrasound waves, which then propagate back to the tissue surface and are measured. How can sound be generated from light? Different tissue types absorb different colours (wavelengths) of light, which is why they look different colours. The most obvious and useful example is blood, which looks red because it absorbs the other colours of light. If tissue is illuminated by light of a wavelength at which blood absorbs strongly, the temperature in the blood vessel will rise as the absorbed light is converted to heat. In order to generate sound, the heating must be fast enough that the tissue does not have time to undergo any significant thermal expansion, i.e., there is no discernible change in density during the heating. This ensures that the very quick increase in temperature in the blood vessels (caused by the absorption of the light pulse) is accompanied by a similarly fast increase in pressure. To make this work in tissue, lasers with pulse durations of less than 10 nanoseconds are used, 10 billionths of a second. This almost instantaneous pressure rise acts like a stone that has been thrown into a pond: it generates a wave – an ultrasound pulse – that travels through the tissue to the surface where it can be detected by ultrasound sensors. This is called the photoacoustic effect.
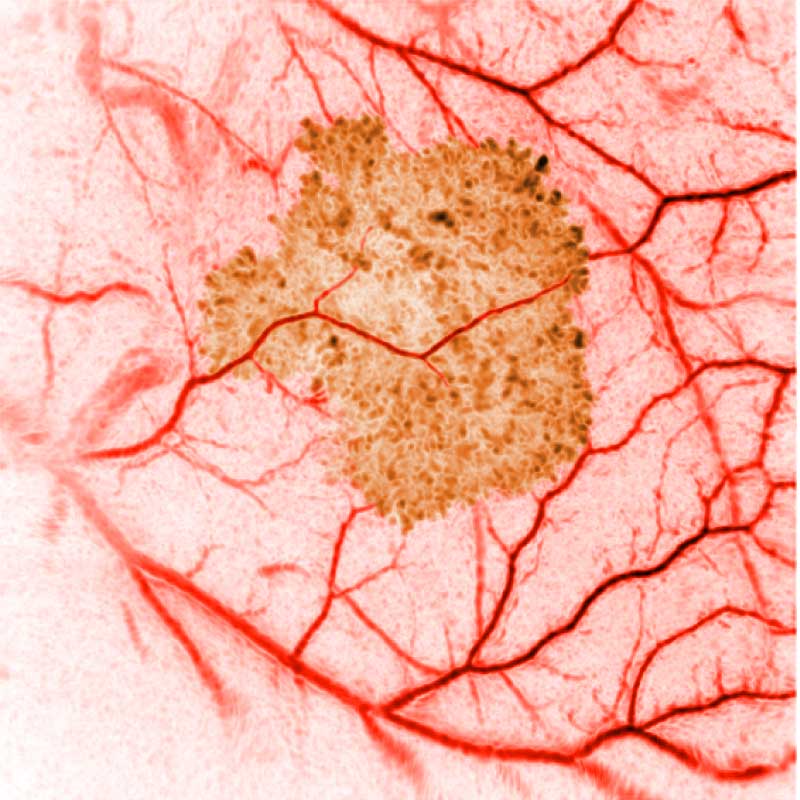
If someone were to throw a stone in a pond, and you and some friends, standing at several places around the pond, recorded how long it took the ripples to reach the edge of the pond, you would, together, be able to triangulate where the stone hit the pond. If many stones were thrown at once it would be harder, but if you could arrange it such that all the stones hit the pond at the same time, it would still be possible to work out where every stone hit, as long as you had enough friends making measurements around the pond. This is the way that image reconstruction works in photoacoustic tomography. By measuring the ultrasound pulse’s arrival time at many places on the surface of the tissue, i.e., the skin, it is possible to work out where in the tissue a pressure increase occurred and how large it was. A map showing these pressure increases is called a photoacoustic image, and it can be a map of the whole 3D tissue volume (see Figure 4). Calculating this map from the measurements is called image reconstruction, and the image that is reconstructed is an image of the initial acoustic pressure distribution following the laser pulse.
Why is that interesting or useful? Because if we know where in the tissue a pressure rise occurred, we know where in the tissue there are regions of higher optical absorption. And if we chose the wavelength of light to be one that is only absorbed by blood, then the photoacoustic image will show a 3D map of the blood vessels in the tissue. In this way, photoacoustic tomography can image much smaller blood vessels than can be measured using Doppler ultrasound. Furthermore, by using different wavelengths, constituents of the tissue that absorb at other wavelengths can also be imaged. Or even, by taking data at several wavelengths, it is sometimes possible to separate it out into images of the different tissue components. Because optical absorption is related directly to the chemical structure of the tissue constituents, photoacoustic tomography can reveal fundamental information about what the tissue is made of, or what it contains, or how it is changing over time. It is therefore of great interest to scientists and doctors looking at the detailed behavior of diseases or potential therapies.
Our research in this area is broadly related to developing novel ways to accurately and quantitatively reconstruct photoacoustic images. This includes using our numerical acoustic models (described in the Computational Modelling tab) as forward models in model-based reconstruction, sometimes exploiting ideas from compressed sensing or machine learning, sensor array modelling. Also, we are interested in investigating the optical aspects of photoacoustics – the link between the optical absorption coefficients and the initial acoustic pressure distribution, sometimes called Quantitative Photoacoustics.
This research is conducted collaboratively with several partners including UCL’s Photoacoustic Imaging Group (who develop novel photoacoustic imaging systems), the Centre for Medical Image Computing, and colleagues at the University of Eastern Finland and Martin Luther University Halle-Wittenberg.
Ultrasound Tomography
Like conventional ultrasound imaging, ultrasound tomography transmits pulses of ultrasound into the body which are subsequently detected and used to form an image. Unlike conventional ultrasound, the transmitted waves are detected as well as the reflected waves (usually at least) and the images formed are (usually, or in the best case scenario) quantitative, eg. an image of the sound speed in units of m/s. Our research in this area is concerned – as with photoacoustics above – in using our numerical acoustic models as forward models in model-based reconstructions. Sound speed images so produced can – linking back – be used in photoacoustic reconstructions to improve the image quality. This research is conducted collaboratively with partners principally in the Netherlands, including CWI, Amsterdam, and the University of Twente.
